What's the difference?
Modelling UK energy to explore the future grid:
The Generation Game
We used detailed records of all the UK’s electricity sources since 2015 to create a timeline of exactly how much output the UK’s wind farms produced, every 30 minutes, in all weather conditions, over the last 10 years. What if we doubled it? Or TREBLED it? This model uses real-world data to see what happens as renewables scale up.
Storage
When the wind drops on a cold dark winter’s night, and the output from wind turbines falls to a trickle, the future grid will rely upon energy stockpiles stored in batteries or other energy reservoirs. This model allows you to explore whether different forms of storage will be able to store enough energy and at what cost. See here why batteries alone are not a cost-effective solution.
Meeting future electricity demand
Electric cars and electric heat pumps are set to add yet more demand on the UK's electricity grid. How much will they add, what other consequences might they have? How could non-energy factors, such as home insulation, affect demand?
The aim of the game is to keep the lights on at minimum cost
Scroll down for controls

Turbine manufacturers are now adapting their power station turbines to run on hydrogen instead of natural gas.
Photo: Wikimedia/ Siemens.com
1
2
3
4
5
Power and (energy) Capacity … crucial difference between MW and MWh:
Just as speed is not the same as distance, power is not the same as energy...
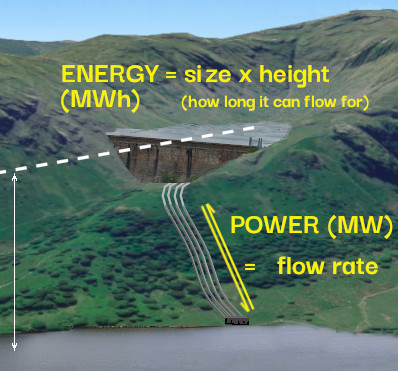 Watts measure POWER, such as the brightness of a 100W light bulb.
Watt-hours measure ENERGY, which includes power and time.
Leaving the light on longer wastes more energy, not power.
To work out how much, we need to know how long it's on for, and how powerful it is. For example, a 100W bulb:
![]()
In 1 hour , it burns 100Wh
In 2 hours, it burns 200Wh…
in 24 hours it burns 2,400Wh, or 2.4 kWh (…or 876kWh in per year!)
It can be confusing - less scrupulous operators often prey on the the confusion to deceive readers, to make their batteries, solar farms, power stations, etc, sound more impressive. A 100W light bulb could be described much more impressively as a 876kWh (per year) light bulb.
Watts measure power (eg. 100W light bulb, or the power of a battery)
Watt-hours measure energy (eg kWh, the units of electricity meters, or the charge of a battery)
Another example: If your phone needs 1W of power to work, you need 12 Wh of charge (energy) to power it for 12 hours.
6
7
8
9
10
The Numbers Behind The Model
The scrollable table below reveals the calculations behind the graphs, and how the model works
It is a useful tool for checking the details of what the model is actually doing.
(Click for notes explaining how the model works)
to hide explanatory notes)
National Grid data provides hourly figures for electricity supply (and by implication, demand). We use these figures to apply real-world performance to hypothetical scenarios. For example, the figures show, hour-by-hour, exactly how much wind power was produced in 2019. Based on these records, our model speculates that if there had been double the number of wind turbines installed in 2019, then the weather-dependant hourly power would have been double what was recorded.
The model uses the new values to see if the new projected values for power generated would have met demand at that moment. If there is excess power, it can be used to charge storage (batteries, pumped hydro, hydrogen...), but is there is not enough to meet demand, then storage must make up the supply. There is also an adjustment for efficiency of the storage medium. For example, lithium-ion batteries are 80-95% efficient, meaning that for every 100kWh of electricity stored, the battery can return 80-95kWh to the grid.
Worked example
At 1am on 1st March, 2015, National Grid supplied 31.4GW of power to the grid to match demand (which must also have been 31.4GW):
| Period | Wind | CCGT | Nuclear | Coal | Import/Export | Other | Total Supply (GW) |
| 22 Feb 2015, 01:00 | 1.6 | 4.8 | 7.8 | 13.4 | 2.5 | 1.4 | 31.4 |
The table shows there was 1.6GW of wind power, which we calculate to be 24% of peak wind capacity at the time. Now we ask What If ... there had been a different amount of wind power installed at that moment? We already know that wind turbines were working at 25% of capacity at that moment, so we could have expected 100GW of installed capacity to yield 25GW (100GW x 25%).
We also know that demand at that moment was 31.4GW (because demand = supply), so we need an extra 6.4GW of electricity from storage in order to meet demand. We use the most efficient storage first - batteries. Supplying 6.4GW of power for 1 hour requires 6.4GWh of electric charge (energy) from the batteries. Lithium-ion batteries are 85% efficient, so during discharge, only 85% of the original energy comes out, so we actually need to discharge 7.5GWh (6.4 / 85%) to supply 6.4GWh back to the National Grid. Once the batteries are exhausted, then we turn to the next most efficient storage, Pumped Storage Hydro (80% efficient), and then Hydrogen+CCGT (48% efficient).
When there is more supply than demand, there is a surplus of electricity, so now energy can be spared to recharge the batteries and other storage, in order of efficiency.
Full charge/discharge cycles completed: