What's the difference?
Modelling UK energy to explore the future grid:
The Generation Game
We used detailed records of all the UK’s electricity sources since 2015 to create a timeline of exactly how much output the UK’s wind farms produced, every 30 minutes, in all weather conditions, over the last 10 years. What if we doubled it? Or TREBLED it? This model uses real-world data to see what happens as renewables scale up.
Storage
When the wind drops on a cold dark winter’s night, and the output from wind turbines falls to a trickle, the future grid will rely upon energy stockpiles stored in batteries or other energy reservoirs. This model allows you to explore whether different forms of storage will be able to store enough energy and at what cost. See here why batteries alone are not a cost-effective solution.
Meeting future electricity demand
Electric cars and electric heat pumps are set to add yet more demand on the UK's electricity grid. How much will they add, what other consequences might they have? How could non-energy factors, such as home insulation, affect demand?
The aim of the game is to keep the lights on at minimum cost
Scroll down for controls

Turbine manufacturers are now adapting their power station turbines to run on hydrogen instead of natural gas.
Photo: Wikimedia/ Siemens.com
1
Cost of wind power
The model assumes that most wind power will be offshore, costing around £2.5 billion/GW.
UK government paints a more optimistic cost estimate of
£1.5 billion
for offshore wind commissioning in 2025.
However, numbers widely reported for large projects are much higher - East Anglia 3
£3.5bn for 1.4GW; Inchcape £2bn for 784MW; DoggerA £3bn for 1.2GW.
2
Cost of solar power
The model uses a cost estimate of £600/kW, assuming 0.5-1MW farms with no battery storage.
UK government cost estimates range from £500/kW for grid-scale farms with over 5MW of panels to around to £1,000/kW for small domestic installations.
3
Cost of nuclear power
New nuclear power units are notorious for massive cost over-runs, such as Vogtle in Georgia (USA), Flamanville in France, and now the UK's own Hinkley Point C. The UK is already committed to building this 3.2GW project, which EDF now estimates will cost
£35 billion (as of 2024).
That puts the cost for new nuclear power around £10 Billion per GWe (GW of electric power),
Decommissioning the UK's existing 17 nuclear sites, that once comprised around 14 GWe
in total, is now projected to take 100 years and cost a staggering £263 billion.
However, Hinkley C's decommissioning costs should be covered by EDF's decommissioning contingency of £8 billion, not taxpayers.
Down time - For this model, we completely ignore down-time for essential maintenance, which could reduce the overall capacity factor to about 80%. So a 3.2GW reactor might only produce 2.6GW on average over its lifetime.
Small Modular Reactors (SMRs) - A lot of focus has been on SMRs recently. Rolls Royce believes that it can deliver these at a much lower capital cost than traditional large nuclear power stations by manufacturing small modules off-site. The building cost savings could be offset against the higher running costs. But the experience of
NuScale Power's costs doubling cautions that SMR costs can spiral out of control just like larger nuclear power plants, and they may even be less cost effective.
Before the Covid pandemic and 2021 fuel crisis, average UK household spent £12 per week on heating (gas or oil), or £624/year. The total heating spend for 29 million households was £18 billion per year, or £450 billion over 25 years.
We estimate very roughly that the cost of retrofitting insulation to reduce heating needs by 2/3 could average £15,000 per dwelling. The nature of work required varies from house to house. Cheap measures include loft insulation or cavity wall insulation. More expensive work includes replacing windows with double- or triple-glazing, solid wall insulation, suspended floor insulation, and making buildings airtight for 'mechanical ventilation heat recovery' systems.
Insulating homes is complicated by the high risks of condensation, mould and rot caused by poor ventilation if it is done incorrectly. Public information for homeowners regarding best practices is very poor and inconsistent. What's more, few householders know if their building contractors understand the inter-related issues of insulation, ventilation and condensation or not. Aesthetic considerations can also have a big impact on costs.
Designing and building new homes to be energy efficient is much cheaper than retrofitting insulation after they have been built. David Cameron's decision to 'cut the Green Crap' by axing home efficiency rules in 2013 means that millions of poorly insulated homes built since then could alone cost an extra £20 billion to insulate.
5
Power and (energy) Capacity … crucial difference between MW and MWh:
Just as speed is not the same as distance, power is not the same as energy...
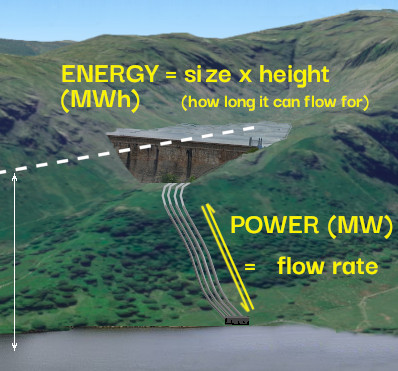 Watts measure POWER, such as the brightness of a 100W light bulb.
Watt-hours measure ENERGY, which includes power and time.
Leaving the light on longer wastes more energy, not power.
To work out how much, we need to know how long it's on for, and how powerful it is. For example, a 100W bulb:
![]()
In 1 hour , it burns 100Wh
In 2 hours, it burns 200Wh…
in 24 hours it burns 2,400Wh, or 2.4 kWh (…or 876kWh in per year!)
It can be confusing - less scrupulous operators often prey on the the confusion to deceive readers, to make their batteries, solar farms, power stations, etc, sound more impressive. A 100W light bulb could be described much more impressively as a 876kWh (per year) light bulb.
Watts measure power (eg. 100W light bulb, or the power of a battery)
Watt-hours measure energy (eg kWh, the units of electricity meters, or the charge of a battery)
Another example: John's phone needs 1W of power to work. To power the phone for 12 hours requires a battery that holds 12Wh of charge.
Battery chemistry is evolving fast, with lithium-ion (solid electrolytes, silicon anodes etc), but also many others, such as lithium metal, lithium sulphur, iron air, liquid metal and various flow batteries. There are so many promising startups making big claims, big progress and little steps, and many bankruptcies on the way. But the targets are clear - cheaper materials, smaller cheaper safer batteries, or for long-term storage, batteries that can store massive amounts of charge at low cost. We will soon have a battery page to keep up to date with the many exciting new developments in fast-evolving battery chemistries.
The big challenge with batteries is capacity: how to store energy affordably on a GWh scale? Much over £20 billion per GWh is not realistic, Our model shows that any long-term energy storage only becomes significant below £20-£30 per kWh, including all inverters/control/connections/site costs etc. Electrolyte for iron-flow batteries could cost $20/kWh, so a low power/ high capacity flow battery system could fall within the target price range, although the (DC-DC) efficiency seems only to be around 70% (or less if converted to/from AC).
This model uses ESS' iron-flow battery efficiency and electrolyte price as a profile, so £20 per kWh and 70% efficient.
Power cost - £500million/GW (power equipment: turbines, pipes, grid connection, etc)
Capacity cost - £25million/GWh of energy (cost of reservoir).
Round-trip efficiency - 80%
Coire Glas, rated at 1.5GW and 30GWh would more than double the UK's existing pumped storage capacity of 24GWh from 4 reservoirs, and 2.8GW of power.
(1) Cost of electrolysis
Leading manufacturer ITM claim that their electrolysers will cost around £500,000 per MW by 2024. Another, NEL, has signed a deal to supply units at €225,000 per MW. We will use the £500,000 figure for now.
(2) Cost storing hydrogen
Storing hydrogen in salt caverns is not significantly different from storing natural gas. It is a mature technology with known costs. Construction of storage caverns is already under way in Northwich and 320GWh at Aldborough.
This model assumes that the cost of capacity is much less significant than the technology for producing hydrogen (electrolysers) or turning it back into electricity (CCGT, or combined cycle gas turbines). It also ignores costs of transport pipelines, and the energy costs of storing and retrieving hydrogen.
(3) Turning hydrogen back into electricity
The most efficient way to generate electricity from hydrogen at present is the same as for natural gas, using CCGT power stations. These can turn about 60% of the energy into electricity, compared to less than 50% for hydrogen fuel cells. See note (8) for CCGT costs.
Hydrogen made by electrolysis is a fuel. To turn it back into electricity, it must be burned in a fuel cell or gas turbine. Fuel cells are only 50% efficient, compared to 60% for the latest H-class turbines that are currently used to generate electricity from natural gas. (Internal combustion engines are less than 25% efficient, wasting over 75% of energy input from fuel). This model assumes that 'H-class' turbines will run on hydrogen by 2030, with 10-minute start-up times.
Efficiency - a GE paper on their gas turbines shows that their H-class 9HA.02 557 MW turbine would use 40,200 kg of hydrogen per hour (40 tonnes per hour!) to operate at full power of 557 MW. This model assumes electrolysers operating at 51kWh/kg of hydrogen, which would take 2,050.2 MWh of electricity to produce 40,200 kg. So the round-trip efficiency of hydrogen-for-power is 557 MWh / 2050 MWh = 27% (single cycle mode), or 41% in combined cycle mode (CCGT uses exhaust gases to power a steam turbine cycle, boosting power produced by 50%)
Cost - This model uses an estimated capital cost for CCGT of £ 1,000/kW, which includes a contingency for O&M (Operation & Maintenance) costs. This article explains more about gas turbines and CCGT used for power generation.
An alternative capital cost estimate from US government suggests similar costs, of $958 + O&M for a state-of-the-art new combined cycle 2x2x1 GE 7HA.02 power station, which we assume GE and competitors will be developing to run on hydrogen at a similar cost.
We ignore the possibility that existing fleets of gas turbines could be converted to run on hydrogen, potentially saving many billions of £
If all UK cars were electric, their combined battery capacity would amount to around 2,000GWh. At times when the grid needs extra electricity to meet demand, the price of electricity goes up, and electric car owners can profit by selling electricity back to the grid at a higher price than they bought it. This is called 'Vehicle-to-Grid'. V2G can be fully-automated, so that vehicle owners don't have to do anything to benefit.
V2G is not suitable for vehicles that need to be kept fully charged, so this model only allows a maximum of 50%, or 1,000GWh of the UK's combined battery capacities to be available. V2G is a last resort to cover short periods of high demand, so the model only uses it when all other sources are exhausted, and prioritises recharging V2G over all other storage, as soon as any surplus becomes available.
The Numbers Behind The Model
The scrollable table below reveals the calculations behind the graphs, and how the model works
It is a useful tool for checking the details of what the model is actually doing.
(Click for notes explaining how the model works)
to hide explanatory notes)
National Grid data provides hourly figures for electricity supply (and by implication, demand). We use these figures to apply real-world performance to hypothetical scenarios. For example, the figures show, hour-by-hour, exactly how much wind power was produced in 2019. Based on these records, our model speculates that if there had been double the number of wind turbines installed in 2019, then the weather-dependant hourly power would have been double what was recorded.
The model uses the new values to see if the new projected values for power generated would have met demand at that moment. If there is excess power, it can be used to charge storage (batteries, pumped hydro, hydrogen...), but is there is not enough to meet demand, then storage must make up the supply. There is also an adjustment for efficiency of the storage medium. For example, lithium-ion batteries are 80-95% efficient, meaning that for every 100kWh of electricity stored, the battery can return 80-95kWh to the grid.
Worked example
At 1am on 1st March, 2015, National Grid supplied 31.4GW of power to the grid to match demand (which must also have been 31.4GW):
| Period | Wind | CCGT | Nuclear | Coal | Import/Export | Other | Total Supply (GW) |
| 22 Feb 2015, 01:00 | 1.6 | 4.8 | 7.8 | 13.4 | 2.5 | 1.4 | 31.4 |
The table shows there was 1.6GW of wind power, which we calculate to be 24% of
peak wind capacity
Peak Wind Capacity
We use the highest recorded wind-power up to that date as a rough proxy for the total available installed nameplate capacity, and use that to calculate a percentage value for wind power at that moment - how much power wind is producing as a percentage of installed capacity. Then we can use this hourly percentage to work out how much power might have been produced if there were double or treble the amount of turbines installed, etc.
The average percentage wind turbine output over time for the period 2015-2021 works out around 41%, which is pretty close to the 45% load factor achieved by large modern offshore turbines that we assume will form the bulk of future wind power. Older onshore turbines have a much lower load factor - around 25% - due to less windy onshore locations and also because they can't reach the more consistent winds 100m above the ground.
Why does the model use 14GW of wind as its starting point? - We know that there was 24GW of wind power installed at the end of 2021, but the peak wind power recorded was only 14GW. For this reason, our model uses a starting point of 14 GW of wind power already installed instead of 24GW. This is a fairly good approximation to 24GW of lower-efficiency turbines (24GW x 25% = 14GW x 43%)
at the time. Now we ask What If ... there had been a different amount of wind power installed at that moment? We already know that wind turbines were working at 25% of capacity at that moment, so we could have expected 100GW of installed capacity to yield 25GW (100GW x 25%).
We also know that demand at that moment was 31.4GW (because demand = supply), so we need an extra 6.4GW of electricity from storage in order to meet demand. We use the most efficient storage first - batteries. Supplying 6.4GW of power for 1 hour requires 6.4GWh of electric charge (energy) from the batteries. Lithium-ion batteries are 85% efficient, so during discharge, only 85% of the original energy comes out, so we actually need to discharge 7.5GWh (6.4 / 85%) to supply 6.4GWh back to the National Grid. Once the batteries are exhausted, then we turn to the next most efficient storage, Pumped Storage Hydro (80% efficient), and then Hydrogen+CCGT (48% efficient).
When there is more supply than demand, there is a surplus of electricity, so now energy can be spared to recharge the batteries and other storage, in order of efficiency.
Full charge/discharge cycles completed: