LNG is a super-polluter that the UK imports to prop up dwindling North Sea gas

Hidden menace of LNG

LNG carrier

LNG imports rise as North Sea gas declines

Your browser will not support this graphic. Try enabling Javascript.

Most UK LNG now comes from the USA:

Data: Dukes 4.5 & 4.2; Photo: WikiMedia/ Kees Torn

World trade in LNG has grown rapidly, first with strong demand in Asia, and then in Europe after Fukushima (2011) and following Russia’s invasion of Ukraine (2022).

What is LNG?

LNG is Liquefied Natural Gas - natural gas, compressed into a liquid that can be carried by ship. Imports into the UK are rising rapidly to fill the gap in supply as North Sea Gas runs out. The problem is that it has a much higher carbon footprint than North Sea gas due to the way it is produced and transported. Worse, official monitoring fails to acknowledge the emissions and effects that scientists are seeing, so governments turn a blind eye to protect their emissions targets.


Methane emissions from LNG are 2-3 times higher than officially reported

Authorities rely on oil and gas producers to self-report their emissions, including CO2 and methane (CH4). However, independent researchers consistently find leaked methane levels 2-3 times higher than the self-reported numbers used by governments, whether measuring it on the ground, from the air or from space. And there's another problem...


Methane potency 3 times higher than benchmark figures suggest

Methane is a powerful greenhouse gas, that traps 120x as much heat as CO2. However, the GWP of methane The Global Warming Potential (GWP) of a gas is the amount of heat that 1kg of it traps compared to 1kg CO2 (…so the GWP of CO2 is 1).

GWP of methane depends upon the time period:
GWP over 1 year (GWP1) = 120
GWP over 20 years (GWP20) = 84
GWP over 100 years (GWP100) = 28

GWP values from IPCC
gets smaller over decades as methane breaks down. Early climate experts adopted the GWP100 standard to study methane's effects over 100 years, which ignores the short term impact. Now that methane is a huge problem, many scientists argue that GWP100 hides methane's dangerous spike in short-term heating potential, and call for a switch to the GWP20 to reflect actual observations. (GWP100 = 28x, GWP20 = 84x)


LNG produces 7kg of emissions in the short term, not just 2.75kg

Burning 1kg methane produces 2.75kg of CO2, but the real footprint is much higher - over 7kg for LNG if considering the effects of methane over 20 year period instead of 100 years:


Table 1: Total emissions from well to consumer, per kg of gas consumed, include 'upstream' emissions, from extraction and transport. Short-term harm of methane leakage (GWP20 = 84) is much worse than the 100-year standard (GWP100 = 28) suggests:

CO2
from burning
Upstream
CO2
Upstream
CH4
Upstream CH4
GWP100 (CO2eq)
Total
(CO2eq)
Upstream CH4
GWP20 (CO2eq)
Total
(CO2eq)
Natural gas 2.75kg 0.2kg 0.015 kg 0.42 kg 3.37kg 1.238kg 4.188kg
LNG 2.75kg 1.062kg 0.040 kg 1.12 kg 4.932kg 3.294kg 7.105kg

LNG's DOUBLE carbon footprint

Producing & transporting LNG doubles carbon footprint of Natural Gas

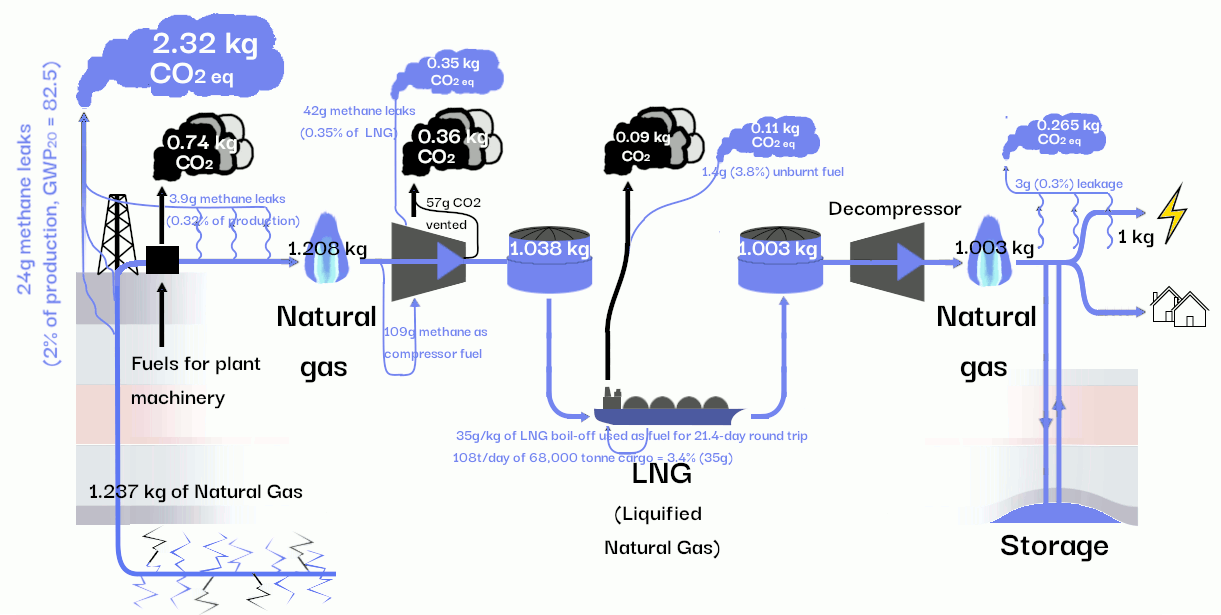
Over half of the UK's LNG now comes from USA. It is produced by hydraulic 'fracking' in the Permian basin in Texas, piped to an LNG Export facility such as Sabine Pass or Corpus Christie to be compressed into liquid, and then shipped.


Your browser will not support this graphic. Try enabling Javascript.
Sources of UK's LNG imports (UK.gov)

Fracking is an energy intensive process, with high CO2 emissions of 0.6kg (per kg of natural gas). Aerial surveys show that wells leak methane, typically around 2% of output Estimates of 'fugitive' methane emissions from gas wells are hard to pin down. Measurements from above (aeroplane/satellite) reveal that producers systematically under-report their emissions, but don't reveal levels for individual wells, which number in the millions for US alone.

MethaneSAT researchers report that:
* Fields targeting gas produce lowest emissions, with loss rates of ~1%.
* Oil, or mixed oil/gas regions have much higher leakage - around 2%.
* Mature basins with older leakier wells can have rates as high as 7%

We use the 2% figure for LNG emission calculations, based on the main US LNG exporting region, Texas' Permian basin.
, with a further 0.3% lost from pipelines after the well.

Compressing the gas into LNG is also an energy intensive process, producing a further 0.35kg of CO2 per kg LNG.


Shipping produces emissions from burning fuel and leaking methane - most LNG tankers use LNG for fuel. Assuming modern LNG tankers burning an average 120 Howarth quotes the following rates for LNG ship fuel consumption:
175 tons LNG/day for steam-powered tankers 130 tons LNG/day for 4-stroke engine tankers 108 tons LNG/day for 2-stroke engine tankers
tonnes of methane each day, taking 21,4 days for a round trip to the UK with a 68,000 tonne LNG cargo. The trip burns 2311 of the 68,000 tonne LNG capacity, roughly 4%, or 40g methane per kg delivered.

Methane fuel burns to produce CO2 emissions - 105g CO2 per kg LNG - but 3.8% of of it slips through the engine unburned, as methane pollution. That's 1.5g methane per kg LNG, or a further 120g CO2 eq).


LNG production and transport - 4.23 kg CO2 eq

= 1.19 kg CO2 + 3.04 kg CO2 eq 'fugitive' methane emissions


LNG gas final consumption - 2.75 kg CO2

(emissions from burning natural gas)

Based upon a paper by R. Howarth (2024) - The greenhouse gas footprint of liquefied natural gas (LNG) exported from the United States

Newer data on fugitive emissions from wells in the Permian Basin from MethaneSAT